Dashboard
- Navigate
- Click on the content list below
to skip ahead to the different sections
on this page -
Pipeline Dashboard
-
Deals By Stage
Pipeline Dashboard
Your Pipeline Dashboard view gives you a quick snapshot of your:
- Lodgements
- Approvals
- Settlements.
As well as a graph of the last six months. The Pipeline Dashboard gives you the
ability to view by week, month or YTD (customised view available in phase 2) with your key statistics for
your lodgements, approvals and settlements.
You can compare your sales statistics with previous years or months and filter them by applications lodged,
approved or settled.
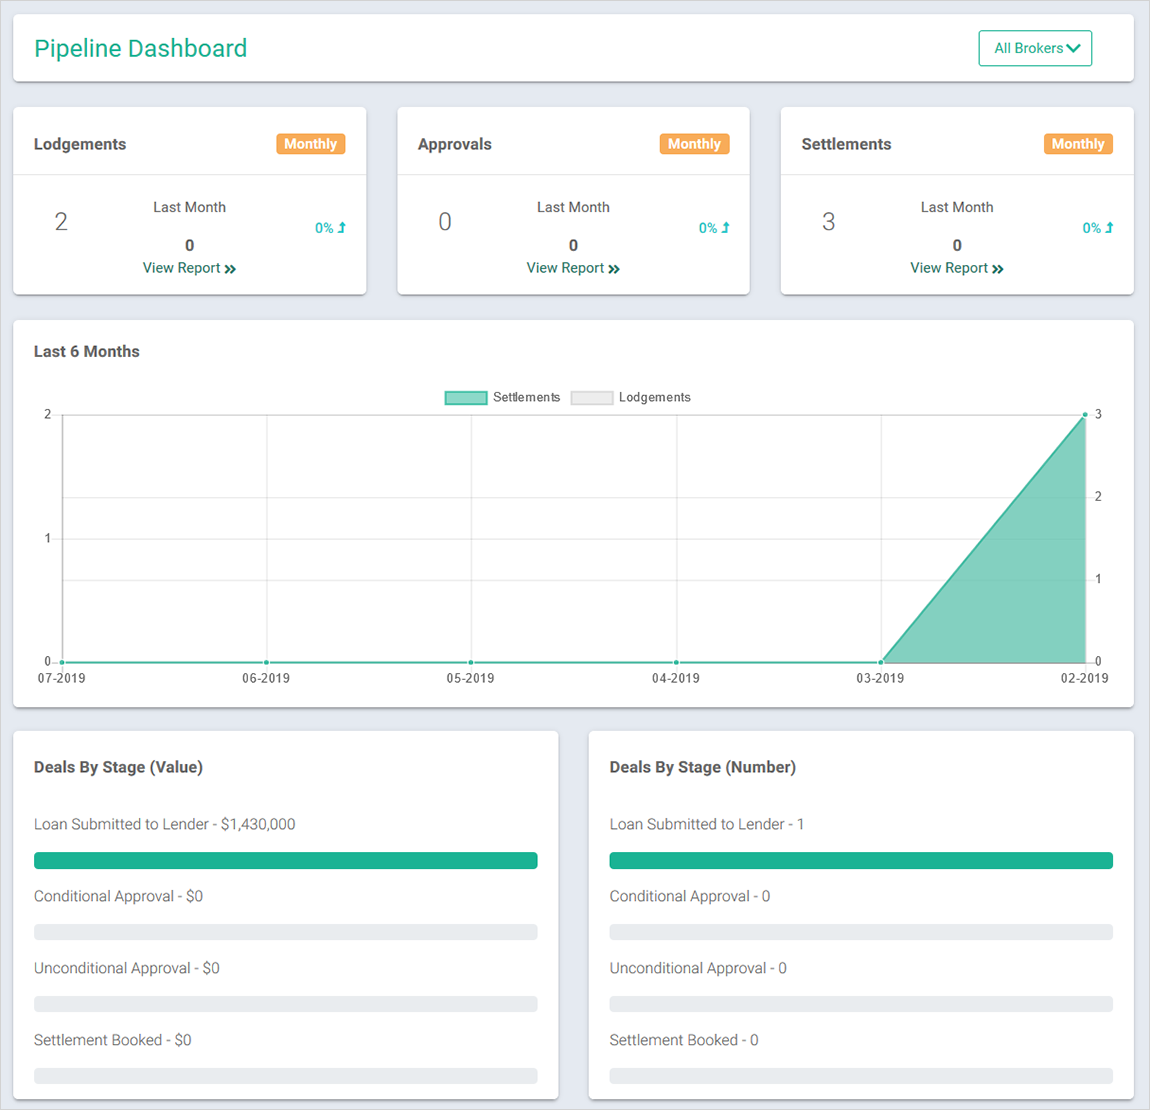
Deals By Stage
The lower half of the page shows you the Deals By Stage (Value) and Deals By Stage (Number) in the following
categories:
- Loan Submitted to Lender
- Conditional Approval
- Unconditional Approval
- Settlement Booked.
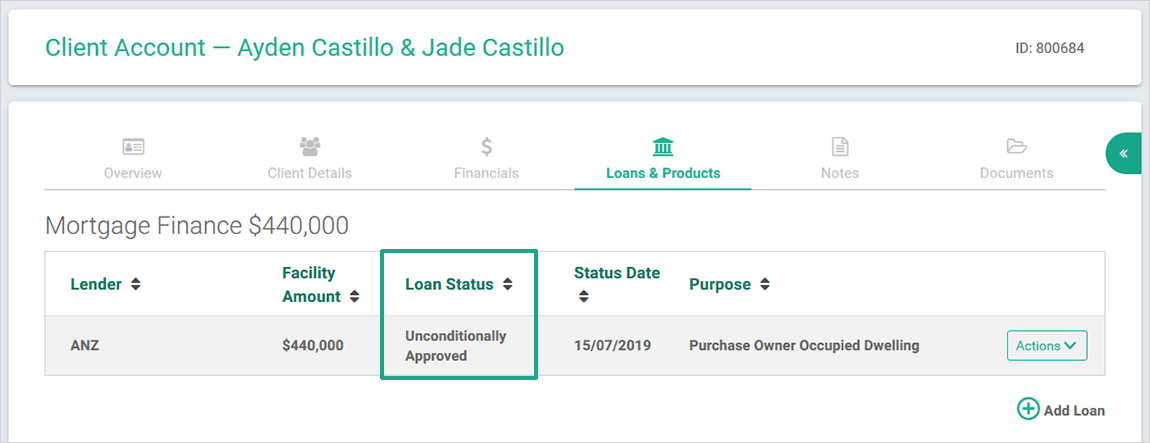
The Pipeline View shows application management metrics resulting from the Loan Status of each client application you have entered as shown: